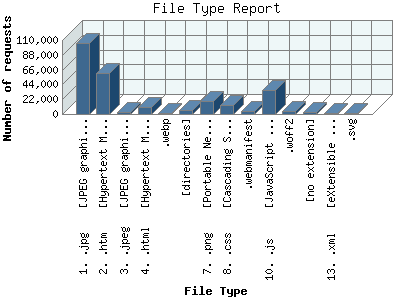
The File Type Report identifies the type of information that is requested from the web site. GIF and JPG are the two types of graphic (image) files that are most commonly supported by web browsers. HTML (sometimes abbreviated HTM), ASP, and [directories] all represent actual pages. The number of image requests will almost always outnumber page requests as one page may contain several images.
This report shows results with at least 0.100000 percent of the total bytes. This report is sorted by amount of bytes transferred.
| File Type | Number of requests | Percentage of the bytes | |
|---|---|---|---|
| 1. | .jpg [JPEG graphics] | 105,018 | 69.89% |
| 2. | .htm [Hypertext Markup Language] | 60,283 | 15.51% |
| 3. | .jpeg [JPEG graphics] | 2,865 | 4.73% |
| 4. | .html [Hypertext Markup Language] | 10,900 | 3.30% |
| 5. | .webp | 1,394 | 1.76% |
| 6. | [directories] | 6,127 | 1.55% |
| 7. | .png [Portable Network Graphics] | 19,070 | 0.54% |
| 8. | .css [Cascading Style Sheets] | 12,673 | 0.47% |
| 9. | .webmanifest | 4,544 | 0.45% |
| 10. | .js [JavaScript code] | 35,990 | 0.32% |
| 11. | .woff2 | 3,763 | 0.24% |
| 12. | [no extension] | 2,872 | 0.24% |
| 13. | .xml [eXtensible Markup Language File] | 753 | 0.23% |
| 14. | .svg | 1,315 | 0.14% |
| [not listed: 124] | 7,748 | 0.63% | |
This report was generated on June 9, 2026 00:00.
Report time frame May 1, 2026 00:01 to June 9, 2026 05:04.
| Web statistics report produced by: | |
 Analog CE 6.0.18 ( Analog CE | Update Check ) Analog CE 6.0.18 ( Analog CE | Update Check ) |  Report Magic 2.21 Report Magic 2.21 |